How promo suppliers and distributors can diagnose friction, quantify operational drag, and match the right modernization play
When a promo business slows down, the first explanation is often the most visible one. A delayed order becomes a production issue. A growing backlog becomes a hiring issue. A missed response becomes a customer service issue. But the visible problem is not always where the friction started.
Among the supplier and distributor accounts we examined closely, the pain patterns differ. For distributors, selling and quoting friction has emerged as the clearest pressure point, pointing to a broader workflow issue at the front of the sales process. For suppliers, the pain is more distributed, with workflow control, catalog accuracy, content readiness, data integrity, and execution capacity all appearing as important areas of drag.
A wrong diagnosis leads to the wrong modernization decision.
This blog examines where friction most often concentrates across promotional products suppliers and distributors, why the visible pain may not be the actual source of the problem, and how each pain area can be mapped to the right modernization play.
Where supplier and distributor friction separates
A pain map becomes useful only when it separates supplier and distributor realities. Among the accounts examined closely, the strongest pattern is that distributor friction is heavily concentrated at the selling and quoting stage, while supplier friction is spread across several operational areas.
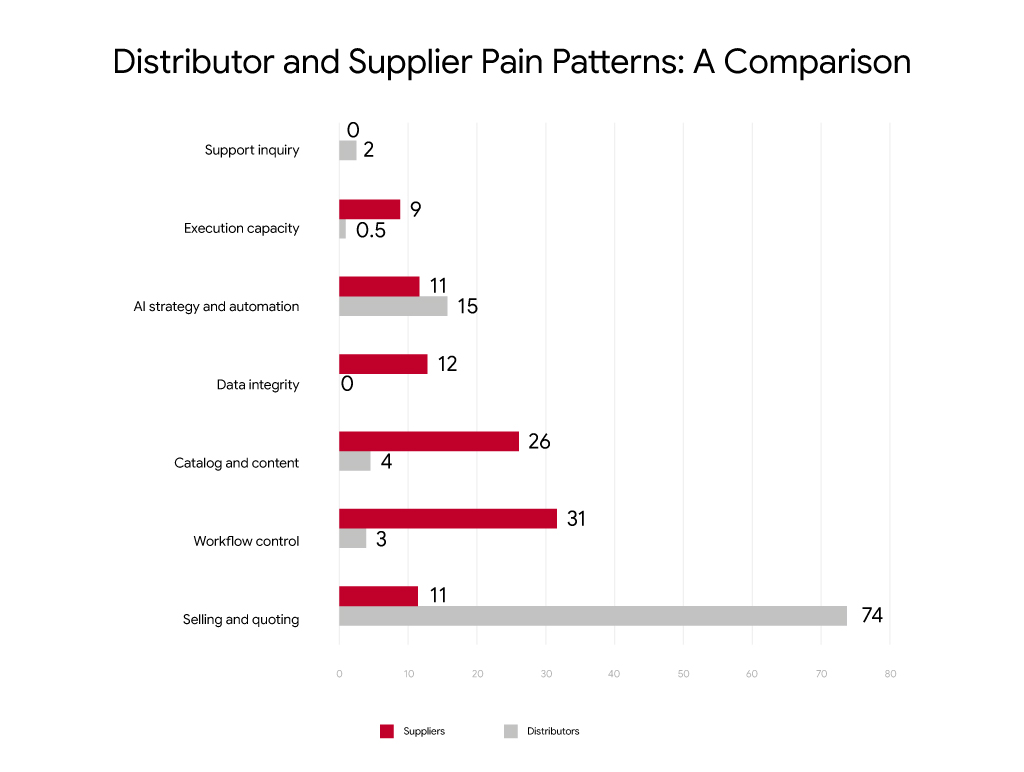
The graph shows why a single modernization path does not work for every promo business. Distributors most often need to address the front of the sales workflow first. Suppliers usually need a more specific diagnosis because their friction can sit in proof control, product data, content readiness, data integrity, or execution capacity.
Supplier and distributor pain is often grouped into a single broad industry conversation, which can make peer discussions too general and vendor conversations too generic. A distributor dealing with quote turnaround and a supplier dealing with proof control or catalog inconsistency may both describe the issue as operational friction, but the first move they need will not be the same.
Why the visible pain may not be the real source
Operational pain is usually felt when pressure becomes urgent, but the real source of drag may lie earlier in the workflow. That creates a diagnostic gap: the business responds to the visible symptom without always seeing the process that caused it.
Without that distinction, the response can become reactive: more hiring, more follow-up, more meetings, or another tool that does not address the actual friction.
A Pain Map helps separate the visible symptom from the workflow creating it.
The Promo Industry Pain Map
The Pain Map connects visible business symptoms to the likely friction area behind them. It helps move the conversation from “what seems to be wrong” to “what should be diagnosed first.”
| What the business may feel | What the Pain Map may show | First play to explore |
| Hiring pressure or team overload | Execution capacity friction: too much repetitive work, backlog, or manual follow-up sitting with internal teams | Embedded Back Office Services |
| Slow quote turnaround or inconsistent proposal speed | Selling and quoting friction: sales capacity is being absorbed by manual pricing checks, quote assembly, or disconnected catalog access | Connected B2B Commerce |
| Production delays or missed timelines | Workflow control friction: proofs, orders, approvals, or handoffs are not moving through a controlled workflow | PromoERP |
| Product data issues or repeated catalog corrections | Catalog and content friction: product information is difficult to maintain, reuse, or publish consistently | AI-Assisted Product Data |
| Conflicting reports or slow leadership visibility | Data integrity friction: records, reports, or workflow data do not align across systems | PromoERP / AI-assisted Product Data |
| High customer service load | Support inquiry friction: routine status, order, or product questions are consuming service capacity | AI-assisted Product Data / Embedded Back Office Services |
| Interest in automation but unclear starting point | AI strategy and automation friction: use cases, data readiness, or workflow rules are not clear enough to support practical adoption | AI Consultancy / AI-Assisted Product Data |
How friction changes as promo businesses grow
Friction does not look the same at every stage of growth. In smaller promo businesses, the main source of drag is often easier to spot because one workflow dominates the business. For distributors, that workflow is usually quoting.
As suppliers and distributors grow, the pain becomes more layered. A business may have quoting friction in one team, proof-control issues in another, catalog inconsistency across product lines, and reporting gaps across leadership. The larger the business becomes, the harder it is to identify the main source of drag solely from leadership conversations.
That is why the Pain Map should not be treated as a one-time label. It is a way to identify which friction area is causing the greatest drag now and which should guide the first modernization decision.
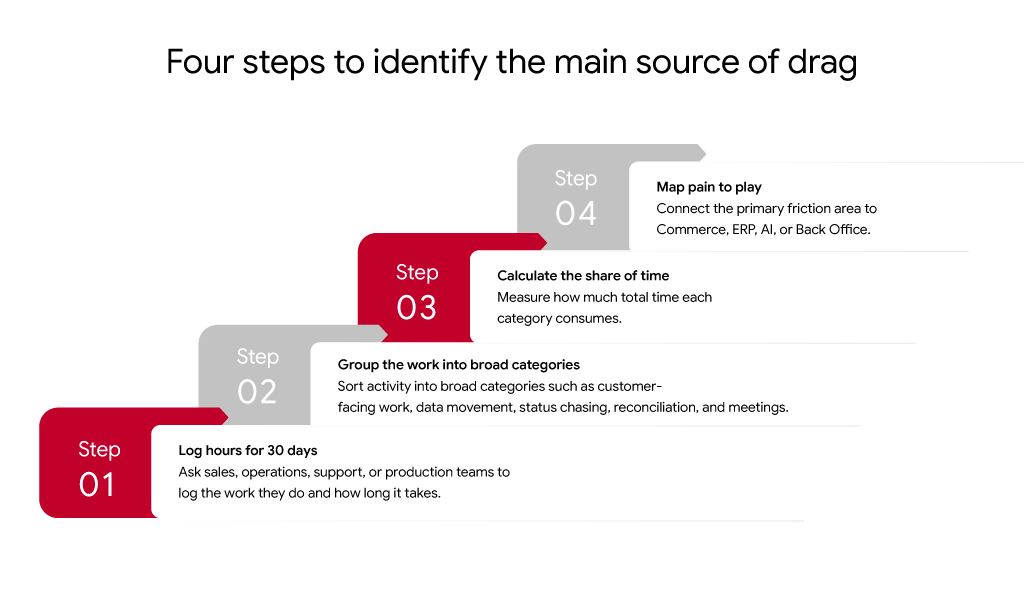
Four steps to identify the main source of drag
A Pain Map becomes useful when it is supported by a simple review of where time is actually going. The goal is not to build a perfect measurement model at this stage. It is to identify which friction area is consuming the most capacity and should guide the first modernization conversation.
Common mistakes when using a Pain Map
A Pain Map is useful only when it guides focus. It can lose value when it becomes another broad-strategy exercise rather than a practical diagnostic tool.
- Treating the loudest issue as the biggest: The problem that escalates most often is not always the workflow creating the most drag.
- Skipping the time review: Without even a basic view of where hours are going, the modernization decision can become opinion-led.
- Trying to solve every pain at once: Most promo businesses have more than one friction area, but spreading effort across too many projects can slow progress.
- Choosing the play before confirming the pain: Commerce, ERP, AI, and Back Office each solve different operating problems. The right first move depends on the primary friction area.
- Treating the Pain Map as permanent: Pain shifts as workflows improve. Once one friction area is reduced, another may become more visible.
The starting point for modernization
Promo suppliers and distributors rarely lack effort. Teams are usually working hard on systems, gaps, exceptions, and customer expectations. The issue is whether that effort is being spent in the right place.
A Pain Map gives leadership a clearer way to see where work is slowing down, where manual effort is accumulating, and which friction area should be addressed first. The category consuming the largest share of non-customer-facing time usually points to the primary friction area and helps determine which modernization play should be considered first.
This blog is part of aws promostack’s 2026 operating model series for the promotional products industry, exploring how suppliers and distributors can diagnose friction, quantify operational drag, and match the right play to the right pain.